Chapter 03
That story about a policy for a better waiting line.
There’s a tax agency, one that is part of the federal government, where it really takes a while before they get back to you. So long in fact, that it was part of the most embarrasing scandal of the decade. It took so long before citizens would get a response from the tax office that by the time they got a notice, it was past the deadline to do anything about it. It was common not to hear any reply for months, even though many financial lives depended on it. Large sums of money are involved here and the financial ruin that it could cause could also wreak havoc on the relationships within families.
Houses needed to be sold, divorces were filed ... it was a bad scene.
To combat this, management figured that they needed to track the situation. It was unacceptable for people to wait so long, so they were going to set targets. After a few meetings it was decided that they were going to keep track of the number of cases that go beyond the 2-month limit. The hope was that, by having a tangible metric, it’d be easier to see if new policies made improvements.
The metric was implemented and as months passed, things were looking up. Way fewer cases passed the 2-month mark than before so, at least internally, people felt like celebrating. The optimism, as would later turn out, was misplaced. Even though the numbers were looking better, the situation for many people had become much worse.
To understand what went wrong it helps to introduce a diagram. Let’s say that this waiting line represents all the people that are waiting for their cases to get handled.

Let’s also say that some people have been waiting for about a week or two, some for a month, and others have passed the two-month mark.
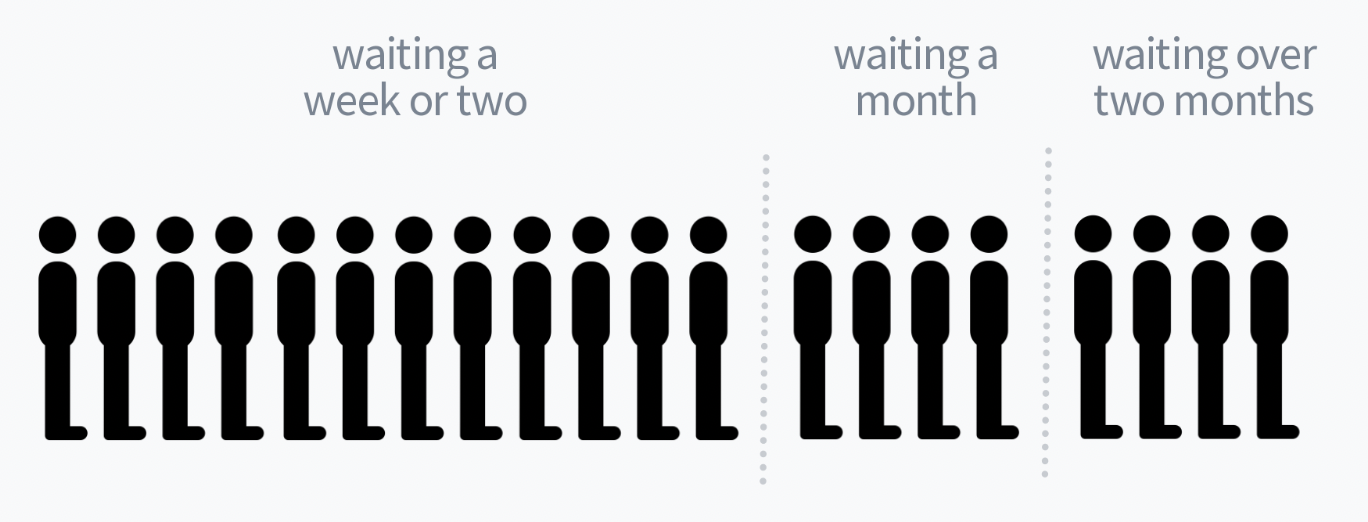
Let’s now suppose that we’re about to start tracking the number of people who pass the two-month mark. We want this number to be as small as possible.
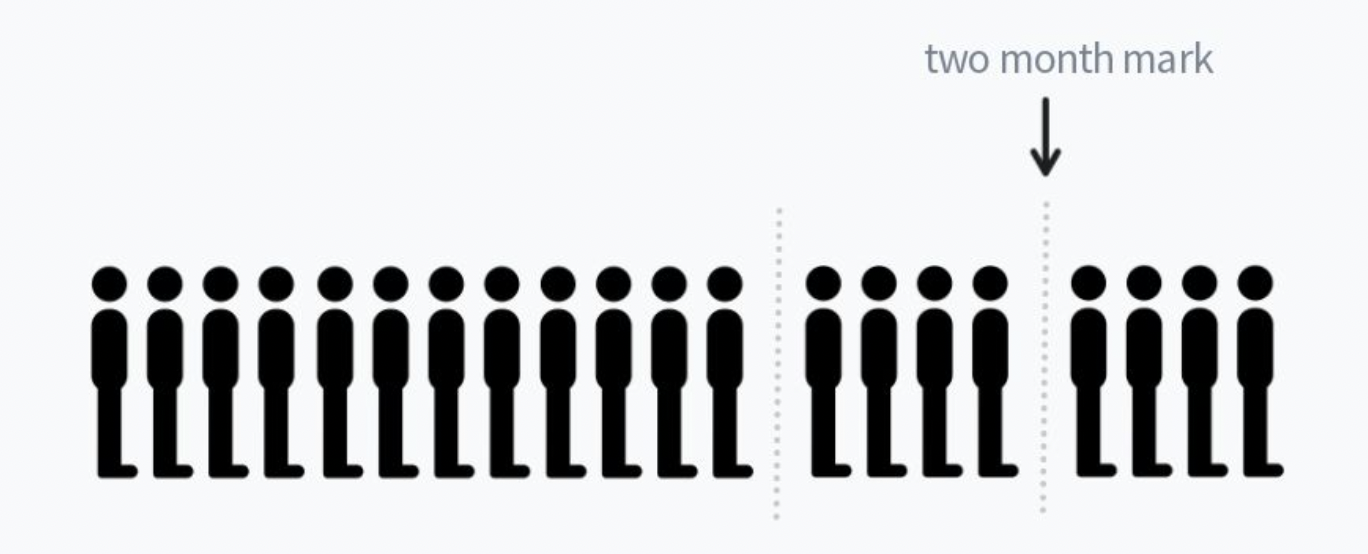
Now imagine that it’s your job to prevent folks from crossing this boundary. Who will you help? Will you help the people who have been waiting for over two months? You could, but helping these people won’t improve your score. You would still be helping people, sure, but your boss may care more about the metric.
So instead, you’d be much better off if you help the people who are the most at risk of passing the two-month mark.
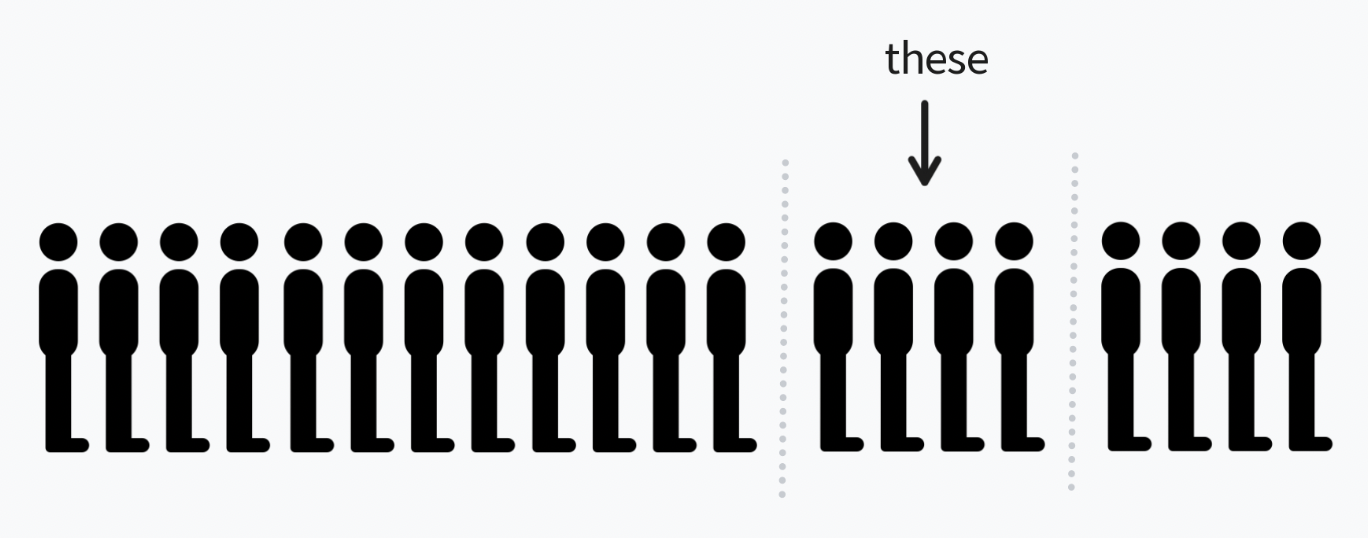
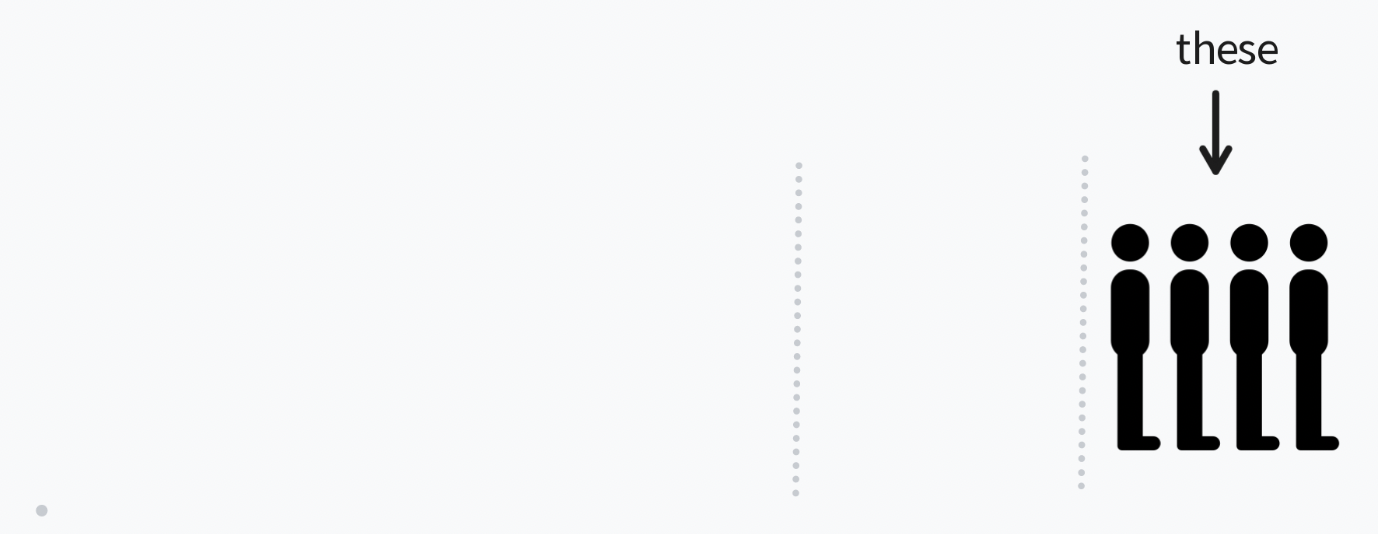
Now imagine that you've helped the group who is just before the main boundary ... who do you help next?
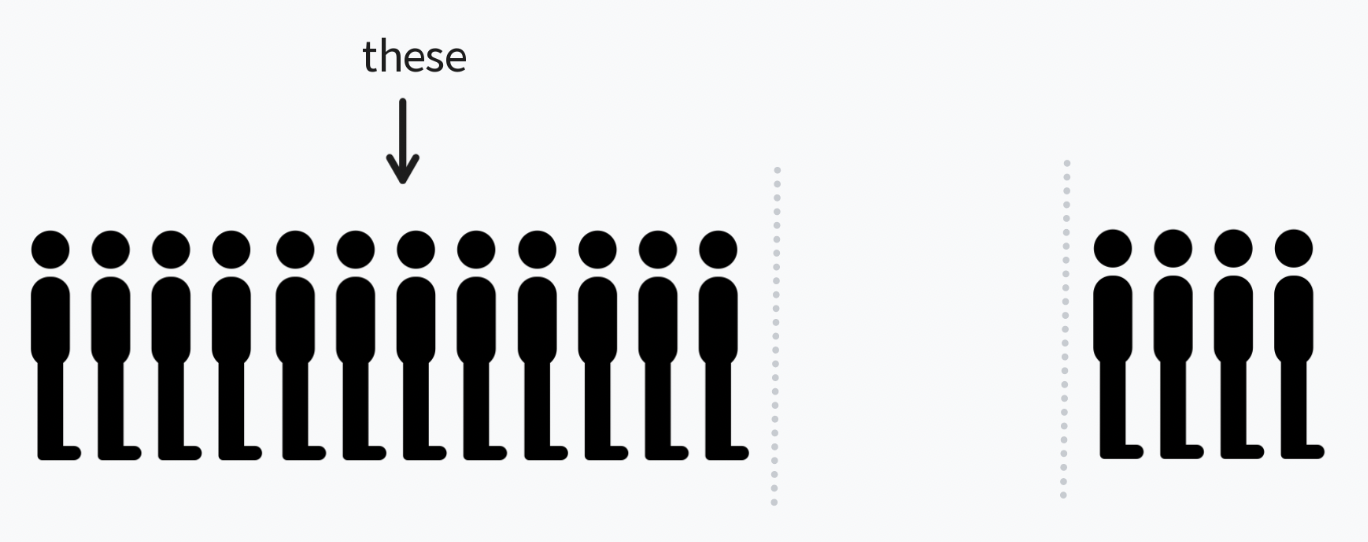
Why would you handle these folks? It's unintuitive irony but if your company is dead serious about data driven incentives then it's all about the metrics. And again, in this case, the metric tracks the number that cross the two month mark. While that assigns more resources toward everyone ahead of that mark, it also completely removes the incentive to help the people who are behind the two-month point. I know it sounds silly, but think about it. You can help these people, but we're incentivizing you to help the people who are capable to cross the two-month mark. Not the folks who already have.
You may be tempted to think that we'd be much better off counting the number of people who got help and were able to leave the queue instead. But unfortunately, there's another awkward aspect of this situation.
Usually, the older a case is the longer it takes to solve. It's much easier to adress a problem when the memory is fresh if only because there's less room for manual errors. So if you want to remove folks from the queue, again you can spot the incentive to help the folks who are at the start of it. These people are the easiest to help, so if you care most about headcount it makes sense to focus on them.
All while this is happening, the poor folks who are waiting for longer than two months will soon be waiting for even longer, getting more complex cases as a result.
Appendix
This is the story of a waiting line, but it’s also the story of a policy that worked against the people it was supposed to help by taking a metric seriously.
If there's any lesson to draw from this is that it really helps not to take metrics at face value. They can be gamed, they can be misleading and you're probably much better off talking to people who have a problem that needs fixing. There's even a name for this phenomenon called "Goodhart's Law", which you should really Google if you've not heard about it before.